
Ulture
Business plan 2027–2029
2027: the year of penetration
and scale.
With a €300k seed, we reach €1M ARR 12 months after the round.
€30k MRR
May 2027: first milestone, proof our ICP buys
Sep 2027
break-even, profitable every month after
€1M ARR
December 2027: 12 months after the round
6.3x
LTV / CAC, fully loaded
Ulture · Almería, October 2026 · Confidential
01
←→Previous / next slide
GGo to any slide
‹›Tap the arrows at the bottom, or swipe
Button at the top right: jump to any slide
linkOn some slides, blue underlined text opens a deep dive. Come back with ← Back, top left
Ulture
Plan de negocio 2027–2029
2027: el año de la penetración
y la escala.
Con una ronda seed de 300.000 €, llegamos a 1 M€ de ARR 12 meses después de la ronda.
30k € de MRR
Mayo de 2027: primer hito, la prueba de que nuestro cliente ideal compra
Sep. 2027
rentables todos los meses a partir de ahí
1 M€ de ARR
Diciembre de 2027: 12 meses después de la ronda
6,3x
LTV / CAC, con todos los costes
Ulture · Almería, octubre de 2026 · Confidencial
01
←→Diapositiva anterior / siguiente
GIr a cualquier diapositiva
‹›Toca las flechas de abajo o desliza
Botón de arriba a la derecha: salta a cualquier diapositiva
enlaceEn algunas diapositivas, el texto azul subrayado abre un detalle. Vuelve con ← Volver, arriba a la izquierda
Ulture
Where are we today?
€0 to €3.7k MRR in four months.
+37% MRR from September to October. No salespeople yet, and not a single farm has left.
MRR per month, € thousands
0.3
1.4
2.7
3.7
4.7
5.7
Jul
Aug
Sep
Oct
Nov
Dec
Actual
Forecast, no salespeople
13
farms paying today
0
farms lost since July
23%
pay the full year upfront: 3 of 13
68%
of demos close so far: 13 of 19
Each farm uses 1.5 apps today and pays about €285 a month, net of the annual-plan discount.
How we got here
921 calls
→
19 demos
→
13 farms
9 from cold calls · 4 from connections and social media
Actual July to October 2026; November and December forecast, with no salespeople. Data as of 23 October 2026.
02
Ulture
¿Dónde estamos hoy?
De 0 a 3,7k € de MRR en cuatro meses.
+37 % de MRR de septiembre a octubre. Aún sin comerciales, y no se nos ha ido ni una finca.
MRR mensual, en miles de €
0,3
1,4
2,7
3,7
4,7
5,7
Jul
Ago
Sep
Oct
Nov
Dic
Real
Previsión, sin comerciales
13
fincas pagando hoy
0
fincas perdidas desde julio
23 %
pagan el año entero por adelantado: 3 de 13
68 %
de las demos acaban en venta: 13 de 19
Cada finca usa hoy 1,5 apps y paga unos 285 € al mes, ya descontado el plan anual.
Cómo llegamos aquí
921 llamadas
→
19 demos
→
13 fincas
9 por llamada en frío · 4 por contactos y redes sociales
Datos reales de julio a octubre de 2026; noviembre y diciembre, previsión sin comerciales. Datos a 23 de octubre de 2026.
02
Ulture
How do the farms use it?
Crews log their work, every single day.
Last 7 days
6,231
activities logged
by the workers themselves.
300 ha
hectares managed across both apps
172
workers registered
517
crop treatments recorded
€161,827
of farm spend in the app
Ulture app data (Tactic + Pest), 11 client farms using the apps, to 25 October 2026. Activities: last 7 days. Demo and internal accounts excluded.
03
Ulture
¿Cómo lo usan las fincas?
Las cuadrillas registran su trabajo, todos los días.
Últimos 7 días
6.231
actividades registradas
por los propios trabajadores: unos 780 registros por finca en una semana.
300 ha
hectáreas gestionadas con las dos apps
172
trabajadores dados de alta
517
tratamientos fitosanitarios registrados
161.827 €
de gasto agrícola en la app
Datos de la app de Ulture (Tactic + Pest), 11 fincas clientes que usan las apps, a 25 de octubre de 2026. Actividades: últimos 7 días. Sin cuentas de demo ni internas.
03
Ulture
How big can this get?
Win Almería first. Then a €73B market.
We count farms with a hired crew (5 or more workers), any crop, greenhouse or open field, in every layer.
Niche · Almería
€54M
4,500 farms that match our ICP
SOM · Spain
€507M
42,500 farms with a hired crew
SAM · Europe
€7.6B
637,000 farms with a hired crew
TAM · World
€73B
6.1M farms with a hired crew
Farms × €11,940 a year; steps not to scale. Spain: Agricultural Census 2020. EU: Eurostat 2020. World: Lowder et al., 2021. Sources and the full table
04
Ulture
¿Hasta dónde puede crecer?
Primero, ganar Almería. Después, un mercado de 58.000 M€.
Contamos fincas con cuadrilla contratada (5 o más trabajadores), de cualquier cultivo, invernadero o aire libre, en todas las capas.
Nicho · Almería
43 M€
4.500 fincas que encajan en nuestro ICP
SOM · España
406 M€
42.500 fincas con cuadrilla contratada
SAM · Europa
6.100 M€
637.000 fincas con cuadrilla contratada
TAM · Mundo
58.000 M€
6,1 millones de fincas con cuadrilla contratada
Fincas × 9.552 € al año; escalones no a escala. España: Censo Agrario 2020. UE: Eurostat 2020. Mundo: Lowder et al., 2021. Fuentes y tabla completa
04
Ulture
23% of our farms pay for the full year, and 100% of them use both apps. · Who they are and what they raised · Why we can’t be copied
05
Why you, and not the software that already exists?
The whole farm, running in days.

Easy to adopt: running in days
Hard to adopt: weeks of training
One part
of the farm
Labour, pests or records alone
The whole
farm
Crew, pests, sensors, logistics and accounting




Ulture
El 23 % de nuestras fincas paga el año completo, y el 100 % de ellas usa las dos apps. · Quiénes son y cuánto han levantado · Por qué no nos pueden copiar
05
¿Por qué vosotros y no el software que ya existe?
Toda la finca, en marcha en días.
Fácil: en marcha en días
Difícil: semanas de formación
Una parte
de la finca
Solo personal, plagas o registros
Toda la
finca
Cuadrilla, plagas, sensores y logística
Ulture
How do we scale this?
Our goal: €1M ARR by December 2027.
How many farms we need
€83,333
MRR, that is €1M of ARR
14.6x the €5.7k we start 2027 with
÷
€380
per farm, per month
2 apps × €199, net of the plan discount
=
220
paying farms needed
to reach €1M ARR
How we get there
20
farms at the start of 2027
+ 246
new farms, January to December
≈ 20 a month: 7 in January, 34 in November
− 46
farms lost on the way
4% churn a month, compounded
= 220
paying farms in December
€1M ARR: 12 months after the round
4% churn a month
A stress test: almost 40% of farms gone in a year. Real churn since July: 0.
2 apps per farm
A floor: today 1.5 with two apps live. Five connected apps sharing data means more apps per farm.
At the pace of our hiring plan, we reach 220 paying farms in December 2027.
06
Ulture
¿Cómo lo escalamos?
Objetivo: 1 M€ de ARR en diciembre de 2027.
Cuántas fincas necesitamos
83.333 €
de MRR, es decir, 1 M€ de ARR
14,6 veces los 5,7k € con los que empezamos 2027
÷
380 €
por finca y mes
2 apps × 199 €, ya descontado el plan anual
=
220
fincas de pago necesarias
para llegar a 1 M€ de ARR
Cómo llegamos
20
fincas a principios de 2027
+ 246
fincas nuevas, de enero a diciembre
≈ 20 al mes: 7 en enero, 34 en noviembre
− 46
fincas que perdemos por el camino
4 % de churn al mes, compuesto
= 220
fincas de pago en diciembre
1 M€ de ARR: 12 meses después de la ronda
4 % de churn al mes
Prueba de estrés: casi un 40 % de fincas fuera en un año. Churn real desde julio: 0.
2 apps por finca
Un suelo: hoy 1,5 con dos apps. Cuatro apps conectadas, con los mismos datos, suben las apps por finca.
Al ritmo de nuestro plan de contratación, llegamos a 220 fincas de pago en diciembre de 2027.
06
Ulture
Where do the 246 new farms come from?
246 new farms, from three channels.
January to December 2027. Cold calls are the engine; social media and events add three and a half a month.
204
Cold calls · 83%
≈ 17 a month
24
Social media and inbound · 10%
2 a month
Farmers who find us online and ask for a demo
18
Events and connections · 7%
1.5 a month
Fairs and co-op talks: a farmer buys from someone he knows
New farms needed to reach 220 paying farms by December 2027. Monthly figures are averages. We count no referrals.
07
Ulture
¿De dónde salen las 246 fincas nuevas?
246 fincas nuevas, de tres canales.
De enero a diciembre de 2027. La llamada en frío es el motor; redes sociales y eventos suman tres y media al mes.
204
Llamadas en frío · 83 %
≈ 17 al mes
24
Redes sociales e inbound · 10 %
2 al mes
Agricultores que nos encuentran en internet y piden una demo
18
Eventos y contactos · 7 %
1,5 al mes
Ferias y charlas en cooperativas: el agricultor le compra a quien conoce
Fincas nuevas necesarias para llegar a 220 fincas de pago en diciembre de 2027. Las cifras mensuales son medias. No contamos ninguna recomendación.
07
Ulture
How many calls is that?
204 farms = 30,600 calls.
To reach €1M ARR by December 2027: 150 calls for every farm we win.
Calls
30,600
Answered
19,890
65%
Qualified
9,945
50%
Fit our ICP
3,481
35%
Interested
1,044
30%
Second call
626
60%
Demos
300
48%
Paying farms
204
68%
Of everyone who answers: 17.5% fit our ICP · ≈ 1% become paying farms
Rates measured in our own CRM: 921 calls logged since July 2026. Bars on a square-root scale; each % converts from the step before.
08
Ulture
¿Cuántas llamadas son?
204 fincas = 30.600 llamadas.
Para llegar a 1 M€ de ARR en diciembre de 2027: 150 llamadas por cada finca ganada.
Llamadas
30.600
Contestan
19.890
65 %
Cualificadas
9.945
50 %
En nuestro ICP
3.481
35 %
Interesadas
1.044
30 %
Segunda llamada
626
60 %
Demos
300
48 %
Fincas de pago
204
68 %
De los que contestan: el 17,5 % encaja en nuestro ICP · el ≈ 1 % acaba pagando
Un comercial
al día, todas a números nuevos
≈ 6 demos
al mes
al mes: cerramos el 68 % de las demos
Tasas medidas en nuestro propio CRM: 921 llamadas registradas desde julio de 2026. Barras en escala de raíz cuadrada; cada % se calcula sobre el paso anterior.
08
Ulture
What does a farm cost to win?
Winning a farm costs €1,312.
Everything we spend on sales and marketing in 2027, divided by the farms we win.
€342,320
sales and marketing, 2027
salespeople, marketing, onboarding, founders’ time, visits
÷
261
new farms in 2027
what the plan wins: 15 more than the 246 we need
=
€1,312
CAC, fully loaded
what one new farm costs us
4.0 months
to earn it back: €1,312 ÷ €331 margin a month
from 2027 to 2028, as our lists, team and onboarding improve
€2.7
of new ARR for every €1 of sales and marketing
Fully loaded: 25% of the founders’ pay and half of customer support count as sales. All of it is already in our profit and loss account.
09
Ulture
¿Cuánto cuesta ganar una finca?
Ganar una finca cuesta 1.312 €.
Todo lo que gastamos en ventas y marketing en 2027, dividido entre las fincas que ganamos.
342.320 €
ventas y marketing, 2027
comerciales, marketing, onboarding, tiempo de los fundadores, visitas
÷
261
fincas nuevas en 2027
las que gana el plan: 15 más de las 246 que necesitamos
=
1.312 €
CAC, con todos los costes
lo que nos cuesta cada finca nueva
4,0 meses
para recuperarlo: 1.312 € ÷ 331 € de margen al mes
de 2027 a 2028, según mejoran nuestras listas, el equipo y el onboarding
2,7 €
de ARR nuevo por cada euro de ventas y marketing
Con todos los costes: el 25 % del sueldo de los fundadores y la mitad de atención al cliente cuentan como ventas. Todo está ya en la cuenta de resultados.
09
Ulture
And what is it worth?
Each farm returns 6.3x its cost.
We assume 4% of farms leave every month; none has left since July.
4%
monthly churn
1 in 25 farms a month
→
25 months
average lifetime
1 ÷ 4%
×
=
€8,275
lifetime value (LTV)
€331 × 25 months
LTV ÷ CAC at 4% churn and 2 apps: €8,275 ÷ €1,312. Twice the 3x benchmark.
4.0 months
to earn back the CAC: €1,312 ÷ €331
LTV = margin per farm ÷ monthly churn.
10
Ulture
¿Y cuánto vale?
Cada finca devuelve 6,3 veces lo que cuesta.
Suponemos que el 4 % de las fincas se va cada mes; desde julio no se ha ido ninguna.
4 %
de churn mensual
1 de cada 25 fincas al mes
→
25 meses
de vida media
1 ÷ 4%
×
=
8.275 €
valor de vida del cliente (LTV)
331 € × 25 meses
LTV ÷ CAC con un 4 % de churn y 2 apps: 8.275 € ÷ 1.312 €. El doble de la referencia de 3x.
4,0 meses
para recuperar el CAC: 1.312 € ÷ 331 €
LTV = margen por finca ÷ churn mensual.
10
Ulture
Base case. MRR net of the annual-plan discount. Costs include every hire in the plan.
11
When does it pay off?
From September, the business pays for itself.
Revenue against costs, month by month: from September, revenue covers costs, every month.
€36k
€59k
€88k
Jan
Feb
Mar
Apr
May
Jun
Jul
Aug
Sep
Oct
Nov
Dec
Jan
Feb
Mar
Apr
May
Jun
2027
2028
May 2027
€36k MRR: milestone passed
Sep 2027
Break-even: profitable every month after
Dec 2027
€1M ARR: 12 months after the round
MRR
Costs
Ulture
Escenario base. MRR ya descontado el plan anual. Los costes incluyen todas las contrataciones del plan.
11
¿Cuándo es rentable?
Desde septiembre, el negocio se paga solo.
Ingresos frente a costes, mes a mes: desde septiembre, los ingresos cubren los costes todos los meses.
36k €
59k €
88k €
Ene
Feb
Mar
Abr
May
Jun
Jul
Ago
Sep
Oct
Nov
Dic
Ene
Feb
Mar
Abr
May
Jun
2027
2028
Mayo 2027
36k € de MRR: hito superado
Sep. 2027
Rentables: todos los meses a partir de ahí
Dic. 2027
1 M€ de ARR: 12 meses después de la ronda
MRR
Costes
Ulture
What if it goes worse?
Even the worst case reaches €30k MRR.
MRR in three cases. Only two things change: churn and apps per farm.
Pessimistic: 7% churn, 1.5 apps · Plan: 4%, 2 apps · Optimistic: 3%, 2.5 apps. See every scenario in depth · How today compares with the plan.
12
Ulture
¿Y si sale peor?
Incluso el peor escenario llega a 30k € de MRR.
MRR en tres escenarios. Solo cambian dos cosas: el churn y las apps por finca.
Pesimista: 7 % de churn, 1,5 apps · Plan: 4 %, 2 apps · Optimista: 3 %, 2,5 apps. Ver cada escenario en detalle · Cómo se compara hoy con el plan.
12
Ulture
Who’s going to do it?
We know the field, the business and AI.
Four founders, all from farming families.







13
Ulture
¿Quién lo va a hacer?
Conocemos el campo, el negocio y la IA.
Cuatro fundadores, todos de familias agricultoras.
13
Ulture
admin@ulture.co · ulture.co
14
Ulture
admin@ulture.co · ulture.co
14
Ulture
Deep dive · D1 · How do you know your numbers?
We have the infrastructure to scale.
Our CRM
Selling
Every call recorded and reviewed with AI
Who to call next, ranked for each salesperson
Follow-ups and demos scheduled automatically
Our admin panel
The farms
Active workers and activity, farm by farm
Farms going quiet, flagged before they cancel
What each farm uses, and what it doesn’t
Every number in this deck comes from these two systems: measured, not guessed.
Built in-house. All data handled within GDPR and our terms of use.
D1
Ulture
En detalle · D1 · ¿Cómo sabéis vuestros números?
Tenemos la infraestructura para escalar.
Nuestro CRM
La venta
Cada llamada grabada y revisada con IA
A quién llamar después, priorizado para cada comercial
Seguimientos y demos agendados automáticamente
Nuestro panel de gestión
Las fincas
Trabajadores activos y actividad, finca a finca
Fincas que se enfrían, detectadas antes de que se den de baja
Qué usa cada finca y qué no
Cada número de esta presentación sale de estos dos sistemas: medido, no supuesto.
Desarrollado internamente. Todos los datos se tratan conforme al RGPD y a nuestras condiciones de uso.
D1
Ulture
Deep dive · D2 · How big is the market?
From 4,500 farms to 6 million.
One unit in every layer: farms with a hired crew × €11,940 a year, what a farm pays for all five apps.
| Layer | Farms | All five | Source |
|---|---|---|---|
| Niche · Almería | ≈ 4,500 | €54M | Greenhouse farms of 2.5–6 ha: ≈ 1 in 3 of Almería’s ≈ 13,400 (Census 2020; Junta de Andalucía) |
| SOM · Spain | ≈ 42,500 | €507M | Horticulture farms, a sector run by crews: 26,823 greenhouse, 13,062 open field, 2,614 mixed (Census 2020) |
| SAM · Europe | ≈ 637,000 | €7.6B | Farms run mainly on hired labour: 7% of the EU’s 9.1 million (Eurostat 2020) |
| TAM · World | ≈ 6.1M | €73B | The largest 1% of 608 million farms, big enough to hire a crew (Lowder, Sánchez & Bertini 2021) |
Hired labour, not crop type, defines a layer: greenhouse and open field both count. Not counted: the 36% of EU farms with some hired labour.
D2
Ulture
En detalle · D2 · ¿Cómo de grande es el mercado?
De 4.500 fincas a 6 millones.
La misma unidad en todas las capas: fincas con cuadrilla contratada × 9.552 € al año, lo que paga una finca por las cuatro apps.
| Capa | Fincas | Las cuatro | Fuente |
|---|---|---|---|
| Nicho · Almería | ≈ 4.500 | 43 M€ | Fincas de invernadero de 2,5 a 6 ha: ≈ 1 de cada 3 de las ≈ 13.400 de Almería (Censo 2020; Junta de Andalucía) |
| SOM · España | ≈ 42.500 | 406 M€ | Explotaciones hortícolas, un sector que funciona con cuadrillas: 26.823 de invernadero, 13.062 al aire libre, 2.614 mixtas (Censo 2020) |
| SAM · Europa | ≈ 637.000 | 6.100 M€ | Explotaciones con mano de obra mayoritariamente asalariada: el 7 % de los 9,1 millones de la UE (Eurostat 2020) |
| TAM · Mundo | ≈ 6,1 M | 58.000 M€ | El 1 % más grande de 608 millones de explotaciones, con tamaño para contratar cuadrilla (Lowder, Sánchez y Bertini, 2021) |
Cada capa la define la mano de obra contratada, no el cultivo: cuentan invernadero y aire libre. No contamos el 36 % de explotaciones de la UE con algo de mano de obra asalariada.
D2
Ulture
Deep dive · D3 · How many farms have this problem?
Every farm is squeezed.
7 in 10 can’t see where.
The squeeze
+66%
minimum wage since 2018
−5.8%
farm prices, while input costs rose +4.7% (EU, Q2 2026)
+4.7%
cost per kilo, Almería 2025/26
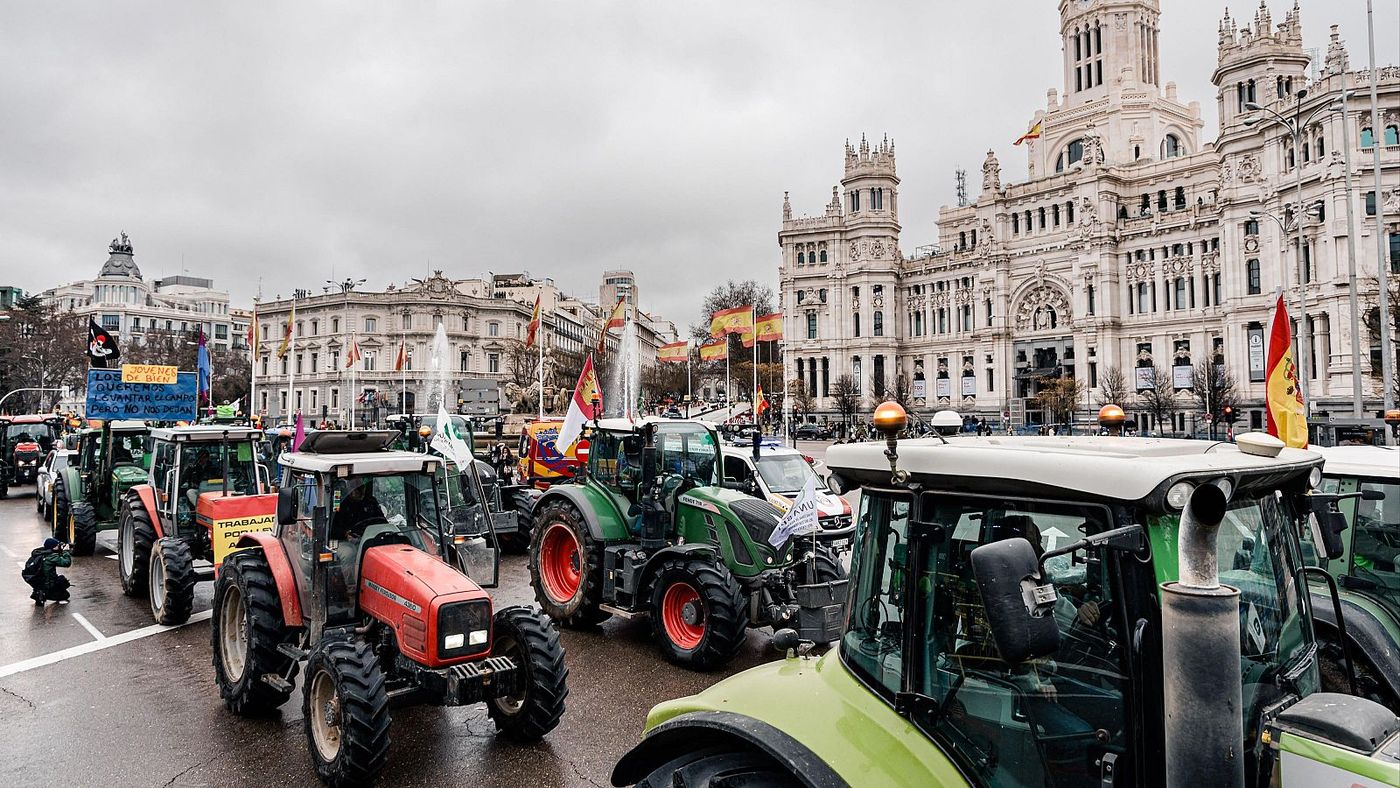
28 Oct
tractors in Madrid over costs
↻
The blind spot
69%
of Spanish farms use no management software
≈ 29,000 farms with a hired crew in Spain
Sources: BOE · Cajamar · Eurostat · Coexphal · MAPA–Cajamar Observatory · press, 2025–2026.
D3
Ulture
En detalle · D3 · ¿Cuántas fincas tienen este problema?
Todas las fincas están ahogadas.
7 de cada 10 no ven dónde.
La presión
+66 %
salario mínimo desde 2018
−5,8 %
precios agrícolas, mientras los insumos subían un 4,7 % (UE, 2.º trim. 2026)
+4,7 %
coste por kilo, Almería 2025/26
28 oct.
tractorada en Madrid por los costes
↻El punto ciego
69 %
de las explotaciones españolas no usa software de gestión
≈ 29.000 fincas con cuadrilla en España
Fuentes: BOE · Cajamar · Eurostat · Coexphal · Observatorio MAPA–Cajamar · prensa, 2025–2026.
D3
Ulture
Deep dive · D4 · Who are the competitors?
Money pours in. Nobody owns it.
< 1%
of Spain’s farms use the biggest player, Isagri + Agroptima: 6,000 customers, as they claimed in 2022. Even if they’ve doubled since, it’s under 2%.
Company releases and press, 2018–2026 · INE agricultural census 2020 (≈ 915,000 farms in Spain).
D4
Ulture
En detalle · D4 · ¿Quiénes son los competidores?
Entra mucho dinero. Nadie lo domina.
< 1 %
de las explotaciones españolas usa al mayor actor, Isagri + Agroptima: 6.000 clientes, según declararon en 2022. Aunque se hayan duplicado desde entonces, siguen por debajo del 2 %.
Comunicados de empresa y prensa, 2018–2026 · Censo Agrario del INE 2020 (≈ 915.000 explotaciones en España).
D4
Ulture
Deep dive · D5 · Why can’t we be copied?
ChatGPT doesn’t know your farm.
Ulture does.
ChatGPT
Ulture
Needs internet
Works offline in the greenhouse
One person, one chat
Worker, supervisor and owner, together
Lives in a browser tab
Sensors and hardware inside the greenhouse
Learns from the internet
Our algorithm learns from real data from real farms
Nobody picks up the phone
A real person picks up the phone
We use ChatGPT and Claude inside Ulture. The farm’s data only lives in Ulture.
D5
Ulture
En detalle · D5 · ¿Por qué no nos pueden copiar?
ChatGPT no conoce tu finca.
Ulture, sí.
ChatGPT
Ulture
Necesita internet
Funciona sin conexión en el invernadero
Una persona, un chat
Trabajador, encargado y dueño, juntos
Vive en una pestaña del navegador
Sensores y hardware dentro del invernadero
Aprende de internet
Nuestro algoritmo aprende de datos reales de fincas reales
Nadie coge el teléfono
Una persona de verdad coge el teléfono
Usamos ChatGPT y Claude dentro de Ulture. Los datos de la finca solo están en Ulture.
D5
Ulture
Deep dive · D6 · When do we hire?
From 8 people to 19, month by month.
| People | Jan 27 | Feb | Mar | Apr | May | Jun | Jul | Aug | Sep | Oct | Nov | Dec | Jan 28 | Feb | Mar | Apr | May | Jun 28 |
|---|---|---|---|---|---|---|---|---|---|---|---|---|---|---|---|---|---|---|
| Founders | 4 | 4 | 4 | 4 | 4 | 4 | 4 | 4 | 4 | 4 | 4 | 4 | 4 | 4 | 4 | 4 | 4 | 4 |
| Salespeople | 2 | 3 | 4 | 5 | 6 | 7 | 7 | 7 | 7 | 7 | 7 | 7 | 7 | 7 | 7 | 7 | 7 | 7 |
| Customer support | 0 | 1 | 2 | 2 | 2 | 2 | 2 | 2 | 2 | 3 | 3 | 3 | 3 | 3 | 3 | 3 | 3 | 3 |
| Developers | 1 | 1 | 2 | 2 | 2 | 2 | 2 | 2 | 2 | 2 | 2 | 2 | 4 | 4 | 4 | 4 | 4 | 4 |
| Marketing and events | 1 | 1 | 1 | 1 | 1 | 1 | 1 | 1 | 1 | 1 | 1 | 1 | 1 | 1 | 1 | 1 | 1 | 1 |
| Total team | 8 | 10 | 13 | 14 | 15 | 16 | 16 | 16 | 16 | 17 | 17 | 17 | 19 | 19 | 19 | 19 | 19 | 19 |
| People cost, €k a month | 22.5 | 28 | 36.5 | 39.5 | 42.5 | 45.5 | 45.5 | 45.5 | 45.5 | 48 | 48 | 48 | 54 | 54 | 54 | 54 | 54 | 54 |
| New farms that month | 7 | 15 | 16 | 20 | 24 | 21 | 14 | 14 | 29 | 29 | 36 | 36 | ≈ 28 | ≈ 28 | ≈ 28 | ≈ 28 | ≈ 28 | ≈ 28 |
Highlighted: the month someone joins. All in, a month: salesperson €3,000 · developer €3,000 · support €2,500 · founder €1,875 · marketing €6,000 with events and ads.
D6
Ulture
En detalle · D6 · ¿Cuándo contratamos?
De 8 personas a 19, mes a mes.
| Personas | Ene. 27 | Feb | Mar | Abr | May | Jun | Jul | Ago | Sep | Oct | Nov | Dic | Ene. 28 | Feb | Mar | Abr | May | Jun. 28 |
|---|---|---|---|---|---|---|---|---|---|---|---|---|---|---|---|---|---|---|
| Fundadores | 4 | 4 | 4 | 4 | 4 | 4 | 4 | 4 | 4 | 4 | 4 | 4 | 4 | 4 | 4 | 4 | 4 | 4 |
| Comerciales | 2 | 3 | 4 | 5 | 6 | 7 | 7 | 7 | 7 | 7 | 7 | 7 | 7 | 7 | 7 | 7 | 7 | 7 |
| Atención al cliente | 0 | 1 | 2 | 2 | 2 | 2 | 2 | 2 | 2 | 3 | 3 | 3 | 3 | 3 | 3 | 3 | 3 | 3 |
| Desarrolladores | 1 | 1 | 2 | 2 | 2 | 2 | 2 | 2 | 2 | 2 | 2 | 2 | 4 | 4 | 4 | 4 | 4 | 4 |
| Marketing y eventos | 1 | 1 | 1 | 1 | 1 | 1 | 1 | 1 | 1 | 1 | 1 | 1 | 1 | 1 | 1 | 1 | 1 | 1 |
| Equipo total | 8 | 10 | 13 | 14 | 15 | 16 | 16 | 16 | 16 | 17 | 17 | 17 | 19 | 19 | 19 | 19 | 19 | 19 |
| Coste de personal, k€ al mes | 22,5 | 28 | 36,5 | 39,5 | 42,5 | 45,5 | 45,5 | 45,5 | 45,5 | 48 | 48 | 48 | 54 | 54 | 54 | 54 | 54 | 54 |
| Fincas nuevas ese mes | 7 | 15 | 16 | 20 | 24 | 21 | 14 | 14 | 29 | 29 | 36 | 36 | ≈ 28 | ≈ 28 | ≈ 28 | ≈ 28 | ≈ 28 | ≈ 28 |
Resaltado: el mes en que entra alguien. Coste total al mes: comercial 3.000 € · desarrollador 3.000 € · soporte 2.500 € · fundador 1.875 € · marketing 6.000 € con eventos y anuncios.
D6
Ulture
Deep dive · D7 · How many farms do we need to call?
150 farms called, one paying farm.
Every call is logged in our own CRM and reviewed with AI, so the script gets better every week.
150
farms called
% of the step above
98
answer
65%
17
fit our ICP
17%
1.5
demos
9%
1
paying farm
68%
≈ 4
new farms a month per salesperson, from 35 calls a day
28
new farms a month with 7 salespeople, by June 2027
No call is wasted: a no to Tactic today is a lead for Sensors or Logistics tomorrow.
A farm called: a new number, dialled once, answered or not.
D7
Ulture
En detalle · D7 · ¿A cuántas fincas tenemos que llamar?
150 fincas llamadas, una finca de pago.
Cada llamada queda registrada en nuestro propio CRM y se revisa con IA, así que el guion mejora cada semana.
150
fincas llamadas
% sobre el paso anterior
98
contestan
65 %
17
encajan en nuestro ICP
17 %
1,5
demos
9 %
1
finca de pago
68 %
≈ 4
fincas nuevas al mes por comercial, con 35 llamadas al día
28
fincas nuevas al mes con 7 comerciales, en junio de 2027
Ninguna llamada se pierde: un no a Tactic hoy es un lead para Sensores o Logística mañana.
Finca llamada: un número nuevo, marcado una vez, conteste o no.
D7
Ulture
Deep dive · D8 · How much does a salesperson sell?
One salesperson: 4 farms a month.
35 calls a day, 17 selling days a month. A salesperson pays for themselves in about two months.
595
calls a month
≈ 6
demos booked
4
new farms: we close 68%
€1,520
new MRR, every month
2.0 months
to pay back a salesperson: €3,000 a month, all in, against €1,520 of new monthly revenue that keeps coming
If calls per farm change
| Calls per farm | 120 | 150 | 180 |
|---|---|---|---|
| New farms a month | 5.0 | 4.0 | 3.3 |
| Months to pay back | 1.6 | 2.0 | 2.4 |
Adrián, head of sales, runs a weekly funnel review with each salesperson.
D8
Ulture
En detalle · D8 · ¿Cuánto vende un comercial?
Un comercial: 4 fincas al mes.
35 llamadas al día, 17 días de venta al mes. Un comercial se paga a sí mismo en unos dos meses.
595
llamadas al mes
≈ 6
demos agendadas
4
fincas nuevas: cerramos el 68 %
1.520 €
de MRR nuevo, cada mes
2,0 meses
para recuperar un comercial: 3.000 € al mes, todo incluido, frente a 1.520 € de ingresos mensuales nuevos que siguen entrando
Si cambian las llamadas por finca
| Llamadas por finca | 120 | 150 | 180 |
|---|---|---|---|
| Fincas nuevas al mes | 5,0 | 4,0 | 3,3 |
| Meses para recuperarlo | 1,6 | 2,0 | 2,4 |
Adrián, director comercial, revisa el embudo cada semana con cada comercial.
D8
Ulture
Deep dive · D9 · How does the sales team work?
One week, one new farm.
| Monday | Tuesday | Wednesday | Thursday | Friday | |
|---|---|---|---|---|---|
| 9:30 | Plan the week with Adrián | Prep the list | Prep the list | Prep the list | Prep the list |
| 10:00 – 14:00 | Call-backs from last week | 35 new calls | 35 new calls | 35 new calls | 35 new calls |
| 14:00 – 15:00 | Lunch | ||||
| 15:00 – 18:00 | Demos | Second calls, WhatsApp | Demos | Second calls, follow-ups | Demos + funnel review |
| 18:30 | Everything into the CRM, every day | ||||
D9
Ulture
En detalle · D9 · ¿Cómo trabaja el equipo comercial?
Una semana, una finca nueva.
| Lunes | Martes | Miércoles | Jueves | Viernes | |
|---|---|---|---|---|---|
| 9:30 | Planificar la semana con Adrián | Preparar la lista | Preparar la lista | Preparar la lista | Preparar la lista |
| 10:00 – 14:00 | Rellamadas de la semana anterior | 35 llamadas nuevas | 35 llamadas nuevas | 35 llamadas nuevas | 35 llamadas nuevas |
| 14:00 – 15:00 | Comida | ||||
| 15:00 – 18:00 | Demos | Segundas llamadas, WhatsApp | Demos | Segundas llamadas, seguimientos | Demos + revisión del embudo |
| 18:30 | Todo al CRM, todos los días | ||||
D9
Ulture
Deep dive · D10 · What is inside the €1,312?
€1,312 a farm, line by line.
Each line of our 2027 sales and marketing spend, divided by the 261 farms we win.
| Sales and marketing, 2027 | Spend | Per farm |
|---|---|---|
| Salespeople, with recruiting and their phones | €211,880 | €812 |
| Marketing and events | €72,000 | €276 |
| Founders’ closing time: 25% of their pay, with phones | €22,740 | €87 |
| Onboarding: half of customer support | €30,000 | €115 |
| Farm visits | €5,700 | €22 |
| Total ÷ 261 farms = CAC | €342,320 | €1,312 |
A salesperson’s month: 160 hours
70 h selling: 4 farms. 90 h on lists, training, admin and slow days. That is why salespeople are the biggest line.
The upside
If a salesperson sold 96 of their 160 hours instead of 70, they would win 5.5 farms a month instead of 4, and the salespeople line would fall from €812 to about €590 a farm.
The same lines as slide 9. Salespeople: €207,000 + €3,500 recruiting + €1,380 phones. Founders: 25% of €90,000 + €240 phones.
D10
Ulture
En detalle · D10 · ¿Qué hay dentro de los 1.312 €?
1.312 € por finca, partida a partida.
Cada partida de nuestro gasto en ventas y marketing de 2027, dividida entre las 261 fincas que ganamos.
| Ventas y marketing, 2027 | Gasto | Por finca |
|---|---|---|
| Comerciales, con selección y teléfonos | 211.880 € | 812 € |
| Marketing y eventos | 72.000 € | 276 € |
| Tiempo de cierre de los fundadores: 25 % de su sueldo, con teléfonos | 22.740 € | 87 € |
| Onboarding: la mitad de atención al cliente | 30.000 € | 115 € |
| Visitas a fincas | 5.700 € | 22 € |
| Total ÷ 261 fincas = CAC | 342.320 € | 1.312 € |
El mes de un comercial: 160 horas
70 h vendiendo: 4 fincas. 90 h en listas, formación, gestión y días flojos. Por eso los comerciales son la partida más grande.
El potencial
Si un comercial vendiera 96 de sus 160 horas en vez de 70, ganaría 5,5 fincas al mes en vez de 4, y la partida de comerciales bajaría de 812 € a unos 590 € por finca.
Las mismas partidas que la diapositiva 9. Comerciales: 207.000 € + 3.500 € de selección + 1.380 € de teléfonos. Fundadores: 25 % de 90.000 € + 240 € de teléfonos.
D10
Ulture
Deep dive · D11 · How does the CAC come down?
The better we sell, the less a farm costs.
Our CAC goes down every year, as our lists, our team and our onboarding get better.
Cost to win a farm
€1,312
2027 average
€1,020
Sep–Dec 2027
≈ €980
2028
What brings it down
Better lists, better script
The CRM shows which farms are warming up; AI-reviewed calls convert more. 150 → 120 calls per farm.
More selling time
The CRM handles scheduling and admin: 70 → 96 of 160 hours spent selling.
Faster onboarding
22 → 8 hours per farm: support grows with farms, not hours.
2027 is the full-year average, summer included (≈ €2,270 in July–August). 2028 applies the levers in steps; our profit and loss account doesn’t count on them.
D11
Ulture
En detalle · D11 · ¿Cómo baja el CAC?
Cuanto mejor vendemos, menos cuesta una finca.
Nuestro CAC baja cada año, a medida que mejoran nuestras listas, el equipo y el onboarding.
Coste de ganar una finca
1.312 €
Media de 2027
1.020 €
Sep.–dic. 2027
≈ 980 €
2028
Qué lo hace bajar
Mejores listas, mejor guion
El CRM muestra qué fincas se están calentando; las llamadas revisadas con IA convierten más. De 150 a 120 llamadas por finca.
Más tiempo vendiendo
El CRM se encarga de la agenda y la gestión: de 70 a 96 de 160 horas dedicadas a vender.
Onboarding más rápido
De 22 a 8 horas por finca: soporte crece con las fincas, no con las horas.
2027 es la media del año completo, verano incluido (≈ 2.270 € en julio y agosto). En 2028 aplicamos las palancas poco a poco; nuestra cuenta de resultados no cuenta con ellas.
D11
Ulture
Deep dive · D12 · How do you get to 87% gross margin?
87% gross margin, line by line.
Revenue minus the cost of serving farms: servers and AI, Stripe, and all of customer support.
One farm, one month · 2028
€380
revenue: 2 apps, net of the annual-plan discount
− €16
servers and AI: 2 apps × €8
− €11
Stripe: 3%, charged on the price with VAT
= €353
the app alone: 93%
− €22
customer support: 6% of revenue in 2028 (€90k)
= €331
gross margin per farm: 87%
By year · thousands of €
| Thousands of € | 2027 | 2028 | 2029 |
|---|---|---|---|
| Revenue | 541 | 1,575 | 2,228 |
| − Servers and AI, €8 per subscription | −22 | −66 | −93 |
| − Stripe, 3% | −16 | −47 | −67 |
| − Customer support | −60 | −90 | −105 |
| = Gross profit | 442 | 1,372 | 1,963 |
| Gross margin | 82% | 87% | 88% |
2027 is lower because support is hired ahead of the farms. The LTV uses 2028, the first full year at scale.
Support counts in full here; its onboarding half is also in the CAC, so we count it twice on purpose. 341: average paying farms in 2028.
D12
Ulture
En detalle · D12 · ¿Cómo llegáis a un 87 % de margen bruto?
87 % de margen bruto, partida a partida.
Ingresos menos el coste de dar servicio a las fincas: servidores e IA, Stripe y toda la atención al cliente.
Una finca, un mes · 2028
380 €
ingresos: 2 apps, ya descontado el plan anual
− 16 €
servidores e IA: 2 apps × 8 €
− 11 €
Stripe: 3 %, sobre el precio con IVA
= 353 €
solo la app: 93 %
− 22 €
atención al cliente: 6 % de los ingresos de 2028 (90k €)
= 331 €
margen bruto por finca: 87 %
Por año · miles de €
| Miles de € | 2027 | 2028 | 2029 |
|---|---|---|---|
| Ingresos | 541 | 1.575 | 2.228 |
| − Servidores e IA, 8 € por suscripción | −22 | −66 | −93 |
| − Stripe, 3 % | −16 | −47 | −67 |
| − Atención al cliente | −60 | −90 | −105 |
| = Beneficio bruto | 442 | 1.372 | 1.963 |
| Margen bruto | 82 % | 87 % | 88 % |
2027 es más bajo porque contratamos soporte antes de que lleguen las fincas. El LTV usa 2028, el primer año completo a escala.
Aquí soporte cuenta entero; su mitad de onboarding también está en el CAC, así que lo contamos dos veces a propósito. 341: media de fincas de pago en 2028.
D12
Ulture
Deep dive · D13 · What makes a farm worth more?
6.3x in our plan. The round makes it bigger.
Our plan assumes 4% of farms leave every month, though none has so far, and 2 apps per farm.
| Churn ↓ · Apps → | 1.5 apps · today | 2 apps | 3 apps |
|---|---|---|---|
| 5% | 3.7x | 5.0x | 7.7x |
| 4% · our plan | 4.6x | 6.3x | 9.7x |
| 3% | 6.2x | 8.4x | 12.9x |
Churn down: support
Support onboards every farm, checks in on day 3 and 10, and calls the week a farm goes quiet.
Apps up: product
Developers build Sensors, Logistics and Accounting; every new app goes to our farms first.
We plan at 4% and 2 apps. Every step down or right is upside.
LTV ÷ CAC, with the same €1,312 to win every farm. LTV = margin per farm ÷ monthly churn; margin per farm = €176 per app − €22 of support. The orange cell is our plan.
D13
Ulture
En detalle · D13 · ¿Qué hace que una finca valga más?
6,3x en nuestro plan. La ronda lo hace crecer.
Nuestro plan supone que el 4 % de las fincas se va cada mes, aunque hasta ahora no se ha ido ninguna, y 2 apps por finca.
| Churn ↓ · Apps → | 1,5 apps · hoy | 2 apps | 3 apps |
|---|---|---|---|
| 5 % | 3,7x | 5,0x | 7,7x |
| 4 % · nuestro plan | 4,6x | 6,3x | 9,7x |
| 3 % | 6,2x | 8,4x | 12,9x |
Menos churn: soporte
Soporte da de alta cada finca, hace seguimiento el día 3 y el 10, y llama la semana en que una finca se enfría.
Más apps: producto
Los desarrolladores construyen Sensores y Logística; cada app nueva llega primero a nuestras fincas.
Planificamos con un 4 % y 2 apps. Cada paso hacia abajo o a la derecha es potencial.
LTV ÷ CAC, con los mismos 1.312 € para ganar cada finca. LTV = margen por finca ÷ churn mensual; margen por finca = 176 € por app − 22 € de soporte. La celda naranja es nuestro plan.
D13
Ulture
Deep dive · D14 · Do you have the monthly detail?
2027, month by month.
| Thousands of € | Jan | Feb | Mar | Apr | May | Jun | Jul | Aug | Sep | Oct | Nov | Dec | 2027 |
|---|---|---|---|---|---|---|---|---|---|---|---|---|---|
| New farms | 7 | 15 | 16 | 20 | 24 | 21 | 14 | 14 | 29 | 29 | 36 | 36 | 261 |
| Revenue | 10.5 | 15.6 | 21.2 | 27.8 | 35.7 | 42.3 | 45.8 | 49.3 | 58.5 | 67.4 | 78.3 | 88.4 | 541 |
| Servers, payments and support | 0.8 | 3.6 | 6.5 | 7.0 | 7.6 | 8.0 | 8.3 | 8.6 | 9.2 | 12.4 | 13.2 | 13.9 | 99 |
| Gross margin | 92% | 77% | 69% | 75% | 79% | 81% | 82% | 83% | 84% | 82% | 83% | 84% | 82% |
| Sales and marketing | 12.0 | 15.0 | 18.0 | 21.0 | 24.0 | 27.0 | 27.0 | 27.0 | 27.0 | 27.0 | 27.0 | 27.0 | 279 |
| Product development | 3.0 | 3.0 | 6.0 | 6.0 | 6.0 | 6.0 | 6.0 | 6.0 | 6.0 | 6.0 | 6.0 | 6.0 | 66 |
| Office and admin | 15.2 | 15.2 | 15.2 | 15.2 | 15.2 | 15.2 | 15.2 | 15.2 | 15.2 | 15.2 | 15.2 | 15.2 | 182 |
| EBITDA | −20.5 | −21.1 | −24.4 | −21.4 | −17.1 | −13.9 | −10.7 | −7.5 | 1.1 | 6.8 | 16.9 | 26.3 | −85 |
| Prepayments | +8.4 | +16.1 | +16.0 | +18.1 | +21.3 | +15.6 | +7.0 | +6.4 | +22.5 | +20.2 | +24.7 | +21.9 | +199 |
| Equipment | −1.7 | −1.7 | −1.7 | −1.7 | −1.7 | −1.7 | −1.7 | −1.7 | −1.7 | −1.7 | −1.7 | −1.7 | −20 |
| Net cash this month | −13.8 | −6.7 | −10.1 | −4.9 | +2.6 | 0.0 | −5.4 | −2.7 | +22.0 | +25.3 | +40.0 | +46.6 | +92.9 |
| Cash (we start with €300k) | 286 | 280 | 269 | 264 | 267 | 267 | 262 | 259 | 281 | 306 | 346 | 393 | 393 |
Thousands of €, base case. Revenue net of the annual-plan discount. Prepayments: cash from annual plans paid upfront, minus the months already counted in revenue, so nothing is counted twice. Year totals as in the profit and loss account; months may not add up exactly due to rounding.
D14
Ulture
En detalle · D14 · ¿Tenéis el detalle mensual?
2027, mes a mes.
| Miles de € | Ene | Feb | Mar | Abr | May | Jun | Jul | Ago | Sep | Oct | Nov | Dic | 2027 |
|---|---|---|---|---|---|---|---|---|---|---|---|---|---|
| Fincas nuevas | 7 | 15 | 16 | 20 | 24 | 21 | 14 | 14 | 29 | 29 | 36 | 36 | 261 |
| Ingresos | 10,5 | 15,6 | 21,2 | 27,8 | 35,7 | 42,3 | 45,8 | 49,3 | 58,5 | 67,4 | 78,3 | 88,4 | 541 |
| Servidores, pagos y soporte | 0,8 | 3,6 | 6,5 | 7,0 | 7,6 | 8,0 | 8,3 | 8,6 | 9,2 | 12,4 | 13,2 | 13,9 | 99 |
| Margen bruto | 92 % | 77 % | 69 % | 75 % | 79 % | 81 % | 82 % | 83 % | 84 % | 82 % | 83 % | 84 % | 82 % |
| Ventas y marketing | 12,0 | 15,0 | 18,0 | 21,0 | 24,0 | 27,0 | 27,0 | 27,0 | 27,0 | 27,0 | 27,0 | 27,0 | 279 |
| Desarrollo de producto | 3,0 | 3,0 | 6,0 | 6,0 | 6,0 | 6,0 | 6,0 | 6,0 | 6,0 | 6,0 | 6,0 | 6,0 | 66 |
| Oficina y administración | 15,2 | 15,2 | 15,2 | 15,2 | 15,2 | 15,2 | 15,2 | 15,2 | 15,2 | 15,2 | 15,2 | 15,2 | 182 |
| EBITDA | −20,5 | −21,1 | −24,4 | −21,4 | −17,1 | −13,9 | −10,7 | −7,5 | 1,1 | 6,8 | 16,9 | 26,3 | −85 |
| Cobros anticipados | +8,4 | +16,1 | +16,0 | +18,1 | +21,3 | +15,6 | +7,0 | +6,4 | +22,5 | +20,2 | +24,7 | +21,9 | +199 |
| Equipos | −1,7 | −1,7 | −1,7 | −1,7 | −1,7 | −1,7 | −1,7 | −1,7 | −1,7 | −1,7 | −1,7 | −1,7 | −20 |
| Caja neta del mes | −13,8 | −6,7 | −10,1 | −4,9 | +2,6 | 0,0 | −5,4 | −2,7 | +22,0 | +25,3 | +40,0 | +46,6 | +92,9 |
| Caja (empezamos con 300k €) | 286 | 280 | 269 | 264 | 267 | 267 | 262 | 259 | 281 | 306 | 346 | 393 | 393 |
Miles de €, escenario base. Ingresos ya descontado el plan anual. Cobros anticipados: el dinero de los planes anuales pagados por adelantado, menos los meses ya contados como ingresos; nada se cuenta dos veces. Totales anuales como en la cuenta de resultados; los meses pueden no sumar exacto por redondeo.
D14
Ulture
Base case, €300k round. Servers, AI and fees: €8 per subscription a month plus 3% Stripe fees, charged on the price with VAT. Rows may not add up due to rounding.
D15
Deep dive · D15 · Where does the money go?
Costs, line by line.
Costs grow 76% in two years; revenue grows 4.1x.
| Thousands of € | 2027 | 2028 | 2029 |
|---|---|---|---|
| Salespeople | 207 | 252 | 252 |
| Founders | 90 | 117 | 144 |
| Developers | 66 | 180 | 252 |
| Customer support | 60 | 90 | 105 |
| Marketing | 72 | 72 | 72 |
| Office, software and admin | 92 | 106 | 120 |
| Servers, AI and payment fees | 39 | 113 | 160 |
| Total costs | 626 | 930 | 1,104 |
| Costs as % of revenue | 116% | 59% | 50% |
Ulture
Escenario base, ronda de 300k €. Servidores, IA y comisiones: 8 € por suscripción al mes más un 3 % de comisión de Stripe, sobre el precio con IVA. Las filas pueden no sumar exacto por redondeo.
D15
En detalle · D15 · ¿A dónde va el dinero?
Costes, partida a partida.
Los costes crecen un 76 % en dos años; los ingresos se multiplican por 4,1.
| Miles de € | 2027 | 2028 | 2029 |
|---|---|---|---|
| Comerciales | 207 | 252 | 252 |
| Fundadores | 90 | 117 | 144 |
| Desarrolladores | 66 | 180 | 252 |
| Atención al cliente | 60 | 90 | 105 |
| Marketing | 72 | 72 | 72 |
| Oficina, software y administración | 92 | 106 | 120 |
| Servidores, IA y comisiones de pago | 39 | 113 | 160 |
| Costes totales | 626 | 930 | 1.104 |
| Costes en % de los ingresos | 116 % | 59 % | 50 % |
Ulture
Deep dive · D16 · What changes in each scenario?
We stress our own plan.
Fewer apps and more churn: in the pessimistic case we reach €30k two months later.
| Key numbers | Pessimistic | Base (the plan) | Optimistic |
|---|---|---|---|
| Apps per farm | 1.5 | 2 | 2.5 |
| Monthly churn | 7% | 4% | 3% |
| Average farm lifetime | 14 months | 25 months | 33 months |
| Calls per farm | 150 | 150 | 150 |
| LTV / CAC | 2.6x | 6.3x | 10.6x |
| €30k MRR | Jul 2027 | May 2027 | Apr 2027 |
| EBITDA-positive | Mar 2028 | Sep 2027 | Jul 2027 |
| MRR in December 2029 | €106k | €203k | €290k |
All three: the same 2027 hiring, 35 calls a day and 3.5 farms a month from social media and events. Pessimistic: 2028 hires frozen.
D16
Ulture
En detalle · D16 · ¿Qué cambia en cada escenario?
Ponemos a prueba nuestro propio plan.
Menos apps y más churn: en el escenario pesimista llegamos a 30k € dos meses más tarde.
| Cifras clave | Pesimista | Base (el plan) | Optimista |
|---|---|---|---|
| Apps por finca | 1,5 | 2 | 2,5 |
| Churn mensual | 7 % | 4 % | 3 % |
| Vida media de una finca | 14 meses | 25 meses | 33 meses |
| Llamadas por finca | 150 | 150 | 150 |
| LTV / CAC | 2,6x | 6,3x | 10,6x |
| 30k € de MRR | Jul. 2027 | Mayo 2027 | Abr. 2027 |
| EBITDA positivo | Mar. 2028 | Sep. 2027 | Jul. 2027 |
| MRR en diciembre de 2029 | 106k € | 203k € | 290k € |
Los tres: mismas contrataciones en 2027, 35 llamadas al día y 3,5 fincas al mes de redes sociales y eventos. Pesimista: contrataciones de 2028 congeladas.
D16
Ulture
Deep dive · D17 · Is the plan realistic?
We already beat the plan.
Real numbers since July, from our own CRM, against what the plan assumes.
Today
The plan
Calls per farm won
≈ 100
921 calls ÷ 9 farms
150
Better than plan
Demos that close
68%
13 of 19
68%
Same as plan
Monthly churn
0%
0 farms lost since July
4%
Better than plan
Apps per farm
1.5
Tactic and Pest
2
Still to grow
The one gap is apps per farm, and it’s exactly what the round builds: Sensors, Logistics and Accounting in 2027.
Real: July to October 2026, CRM and billing data. Plan: base case for 2027.
D17
Ulture
En detalle · D17 · ¿Es realista el plan?
Hoy ya superamos lo que asume el plan.
Datos reales desde julio, de nuestro propio CRM, frente a lo que asume el plan.
Hoy
El plan
Llamadas por finca ganada
≈ 100
921 llamadas ÷ 9 fincas
150
Mejor que el plan
Demos que acaban en venta
68 %
13 de 19
68 %
Igual que el plan
Churn mensual
0 %
0 fincas perdidas desde julio
4 %
Mejor que el plan
Apps por finca
1,5
Tactic y Pest
2
Por crecer
La única diferencia son las apps por finca, y es justo lo que construye la ronda: Sensores y Logística en 2027.
Real: de julio a octubre de 2026, datos del CRM y de facturación. Plan: escenario base de 2027.
D17
Ulture
Deep dive · D18 · What exactly are we proposing?
€300k on a SAFE. You come in first, at 20% off.
No valuation today: it’s too early to price fairly. You convert at our Series A, 20% below the new investors’ price.
The terms
Amount
€300,000
Instrument
SAFE
Discount
20% on the Series A price
Converts
Series A, planned Q1 2028
Valuation cap
None
What it buys
246
new farms in 2027
220 paying farms and €1M ARR by December 2027
Our commitment
We funded the pre-seed with our own money.
Four founders, full-time, all in.
Factories run on SAP. Farms will run on Ulture.
D18
Ulture
En detalle · D18 · ¿Qué proponemos exactamente?
300k € con un SAFE. Entras primero, un 20 % más barato.
Hoy no fijamos valoración: es pronto. Conviertes en nuestra Serie A, un 20 % por debajo del precio de los nuevos inversores.
Las condiciones
Importe
300.000 €
Instrumento
SAFE (nota convertible en España)
Descuento
20 % sobre el precio de la Serie A
Conversión
Serie A, prevista para el 1T 2028
Límite de valor
Ninguno
Lo que compra
7 comerciales
≈ 28 fincas nuevas al mes en junio de 2027
2 desarrolladores
Sensores, Logística y Contabilidad: el ecosistema completo
6k € al mes de marketing
Eventos, anuncios y una persona de marketing
Nuestro compromiso
El pre-seed lo pusimos con nuestro propio dinero
Cuatro fundadores, a tiempo completo, con todo
Nos pagamos 1.875 € al mes mientras lo construimos
Las fábricas funcionan con SAP. Las fincas funcionarán con Ulture.
D18
Ulture
Deep dive · D19 · How do I get my money back?
Three kinds of buyers. All already buying.
What it could mean for you · illustrative, about 3.75% after the Series A
Exit at €50M
6x
€1.9M back to you
Exit at €90M
11x
€3.4M back to you
Exit at €200M
25x
€7.5M back to you
Agri giants buy data
Deere
Blue River · 2017
Deere
Bear Flag · 2021
DuPont
Granular · 2017
Nutrien
Agrible · 2018
Farm software buys customers
Isagri
Agroptima, Spain
xFarm
Greenfield, Spain
Funds are already in
Hispatec
Almería
IKOS
Almería
Our edge: the data nobody else has. What every crew does, task by task, line by line, every day.
D19
Ulture
En detalle · D19 · ¿Cómo recupero mi dinero?
Los gigantes del agro compran datos.
Los gigantes del agro compran datos y tecnología
Deere
Blue River · 305 M$ · 2017
Deere
Bear Flag · 250 M$ · 2021
DuPont
Granular · 300 M$ · 2017
Nutrien
Agrible · 63 M$ · 2018
El software agrícola compra clientes
Isagri
Compró Agroptima (España) · 7 compras en un año
xFarm
Compró Greenfield (España)
Los fondos ya han entrado
Hispatec
Capital riesgo, 2024
IKOS
8 M€ levantados en 2026
Nuestra ventaja: los datos que nadie más tiene. Lo que hace cada cuadrilla, tarea a tarea, línea a línea, cada día: casi 900 actividades al día, y creciendo con cada finca.
Lo que podría suponer para ti
Ilustración, no previsión: SAFE con un 20 % de descuento en una Serie A de 8 M€ pre-money que levanta 2 M€. Operaciones según la prensa.
D19